understanding the dashboards
When you log in to Portfolytics, the dashboards are built to give you a quick overview of what’s happening in your store – and where your products are performing (or not).
No digging through reports, exporting CSVs or searching for hidden data. Everything updates automatically.
The top bar: what you’ll use most
The menu at the top lets you switch between different ways to look at your store’s performance:
- Hierarchy
- Collections
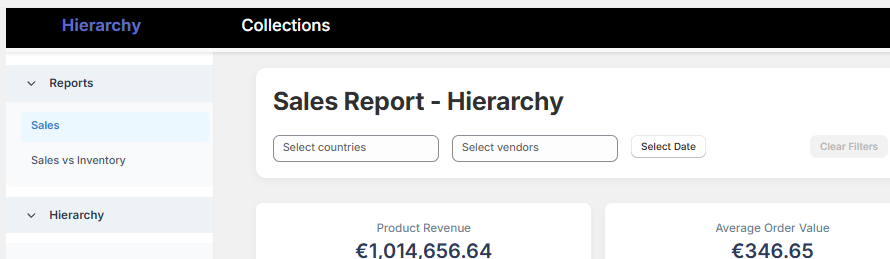
Start with Collections if you’re not sure where to begin. The default report is called Sales which is a great place to start. We’ll cover Sales vs Inventory in more detail here but everything here applies to all the dashboards. We’re trying to keep things simple.
Key Performance indicators (KPIs)
Just under the menu you’ll see some big numbers – those are your Key Performance Indicators. These update based on the date range and other filters (totally optional) you choose. The KPI’s change based on which view (Hierarcy, Collections) or report (Sales, Sales vs Inventory) you are in.
Some of the KPIs available:
- Total product sales €
- Number of productrs online
- AOV and average product price for products sold
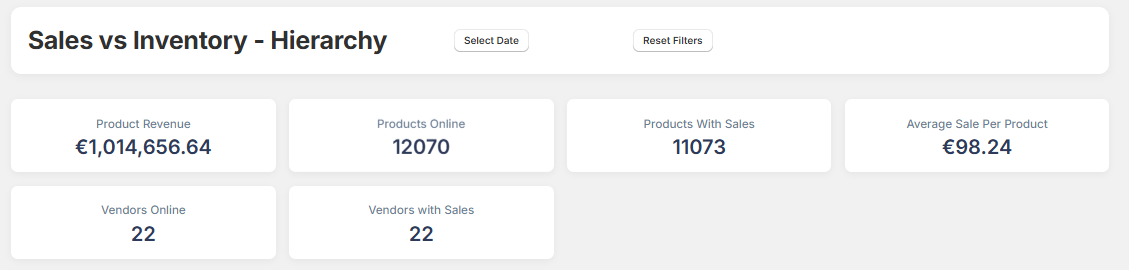
It’s a quick pulse check. You don’t need to click anything to see what’s going on.
filtering
In the top right, you can choose which time period you want to analyze. You might want to look at just the past 30 days, or see how your store did during a specific campaign. You can optionally also filter by the client country or the product vendor. Up to you.
Drill down by clicking
Portfolytics is built so you can click on (almost) anything and dig deeper.
- Click a collection to see which products in that collection sold
- Click a main category in your hierarchy to open subcategories
- Click any subcategory or a collection, to update the product table below
The product table always responds to your selection. No need to refresh or reapply filters. Note that the
The product table
At the bottom of most views is the product table. Depending on the report you might see:
- Name of the product
- Sales for the product
- Number of products sold
- Status of the product (Active or inactive)
- Product type
After selecting a collection or category the table will only show products from that product group.