Getting started with portfolytics
How to install
- Go to the Shopify App Store from HERE.
- Click “Install”
- Click “Accept” for the read-only scopes we need
- App starts installing
When you install the app it will digest data of all the products, collections and sales data of your store through Shopify APIs. Depending on the size of you store this might take a while.
Our test store with 3 000 orders, 50 collections and 12 000 products took about 15 minutes. This is only a one-time thing and after the installation the app is very fast to use.
How to get around
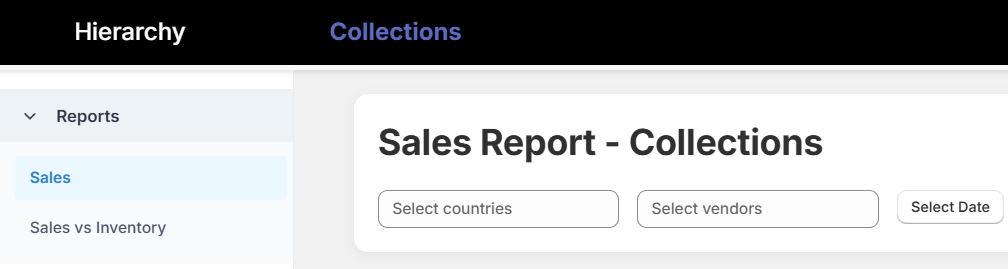
When you open the app the default dashboard will load automatically. On the top you have two views to your collections or to your product hierarchy, and on the left side pane you have two reports, Sales and Sales vs Inventory. So in total there are four different reports:
- Collections – Sales
- Collections – Sales vs Inventory
- Hierarchy – Sales
- Hierarchy – Sales vs Inventory
There are also filters in the top . You can use them to filter orders to certain countries or products from certain Vendors. You can also filter the orders based on dates, of course.
Collections – Sales
Your Shopify collections and their sales data in a easy-to-read tables. Click on any collection to see the Product Sales table below update.
Hierarchy – Sales
This is where you can find the product hierarchy that you have created in your Main Menu (usually visible to your customers in your store’s header). You can click on any main category to see the subcategory and product data update. Clicking on a subcategory will update the Product Sales table with relevant products.
To find out how the Collection and Hierarchy sales data differ from each other please refer to the end of the glossary page.
Collections – Sales vs Inventory
They differ from the Sales reports by offering data about the inventory/portfolio width. For example, you can see how many unique products you have in your collections and you can also see how many of them have sold. The app also shows a handy KPI called Sales vs Products Online that tells you how efficient your collections really are.
Hierarchy – Sales vs Inventory
Very similar to the Collections – Sales vs Inventory dashbord except that it offers the data in a hierarchical view. You can again click on a main category to see the subcategory and product level data update, but in addition to that you can also see how many products each category has and how many of them have sold. Sales vs Products Online could also be a useful KPI.
Final notes
The app is meant to be both very simple to use and to offer some insights that no other Shopify app can offer with no setup at all necessary. I highly recommend you to check out the best and worst performing collections and categories, dig a big deeper into the subcategory and product level to see what sets them a part and step-by-step start improving your store.
This article is only meant to give you a very brief orientation what the app does, so if you want to check out some practical tips to sell more with the help of Portfolytics, check out this quick wins guide.